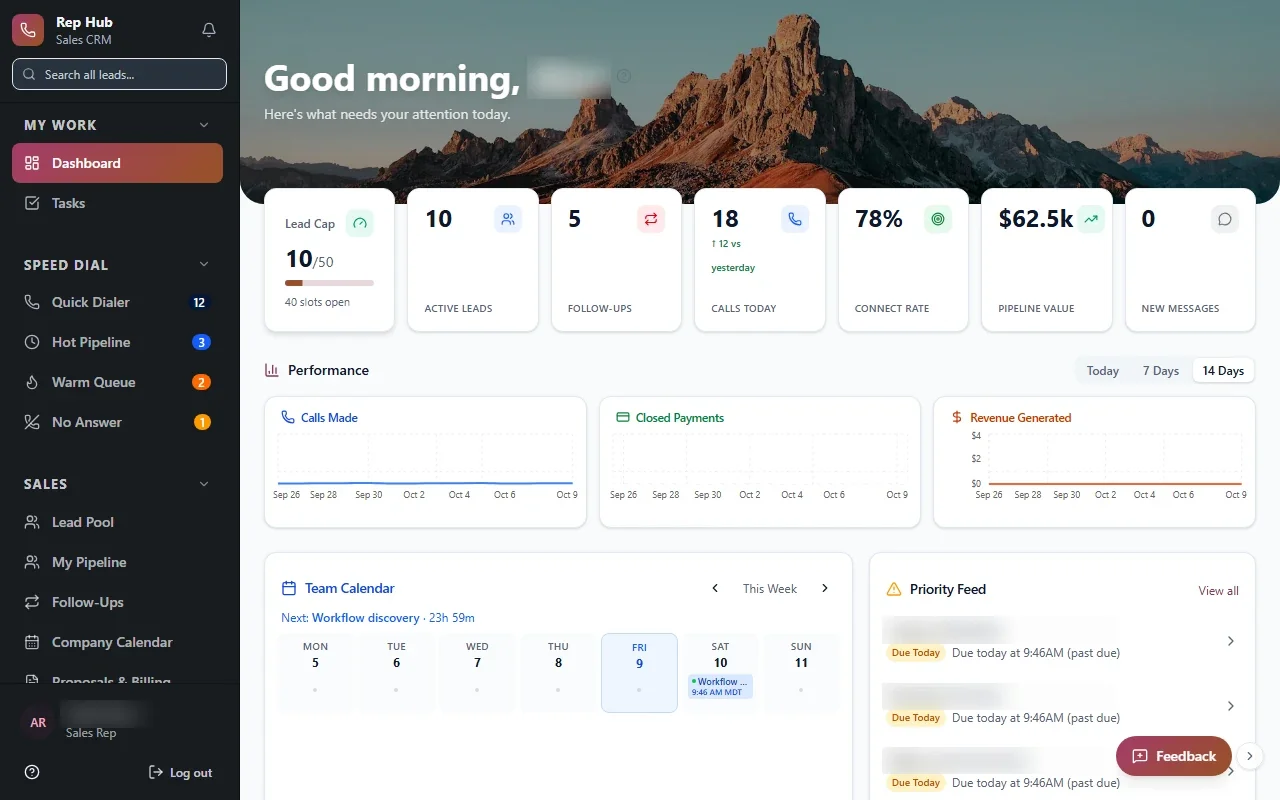
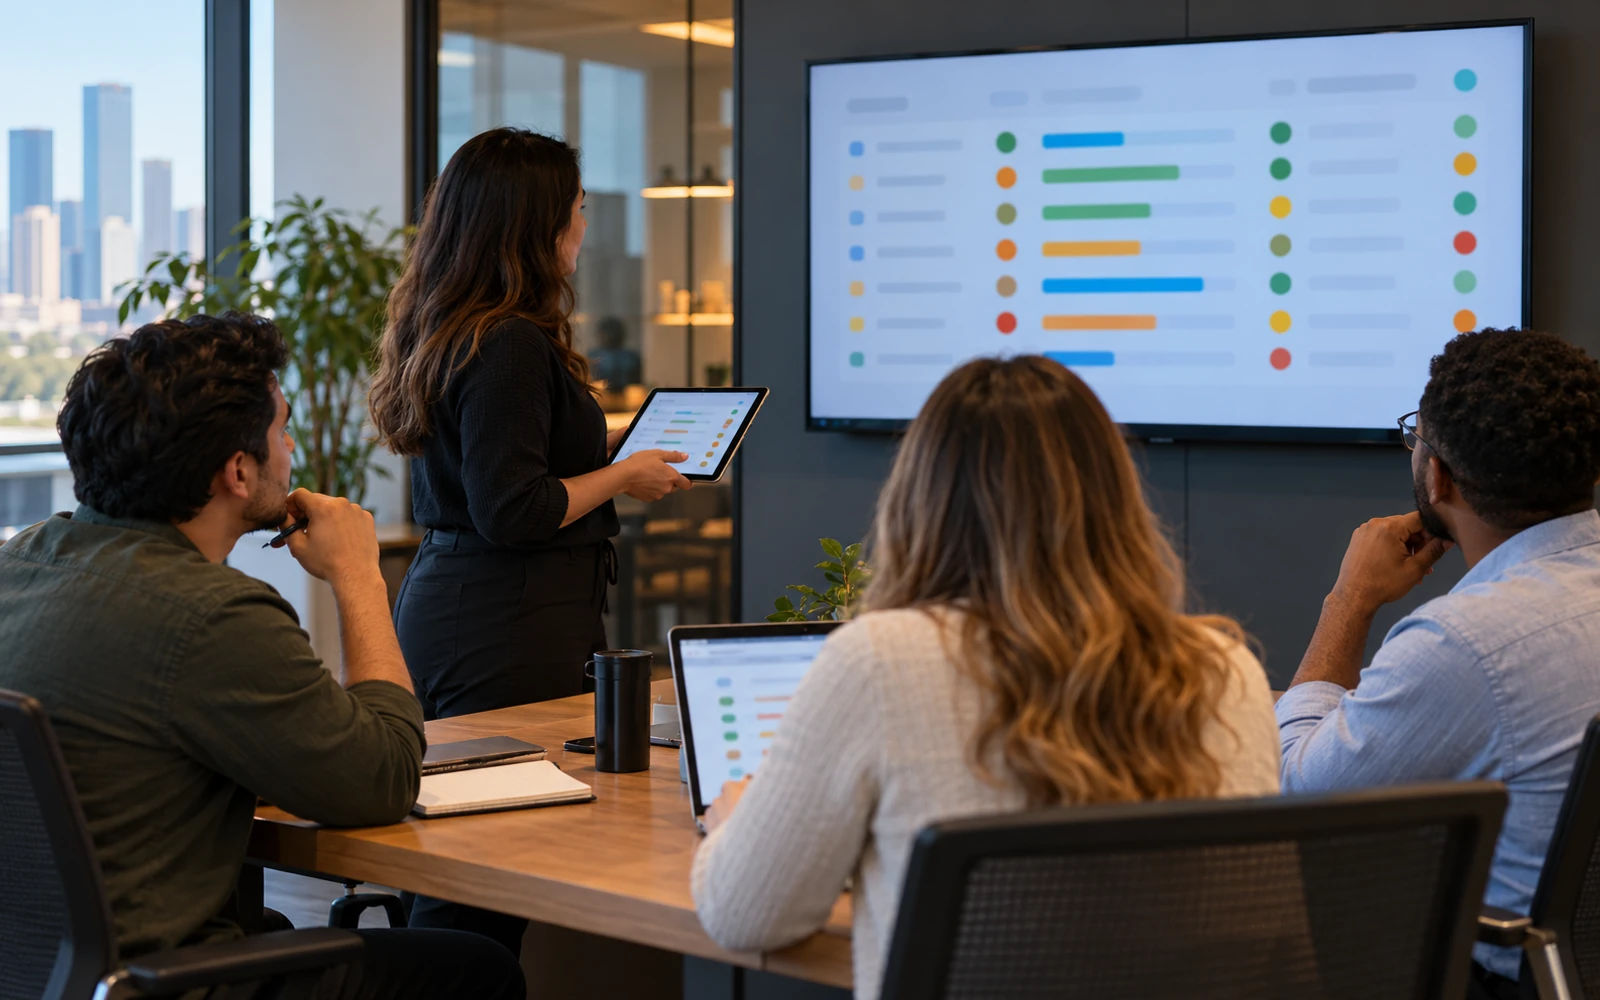
That works until the business grows, a key person goes on vacation, or two copies of the same file disagree. We build custom screens and dashboards that replace that patchwork. Each one is designed around a real task, records the work once, and points to the person who moves it forward. When a number looks wrong, you click through to the cases behind it and act on them in the same place, instead of opening five tabs to find out why.
Signs your team has outgrown the spreadsheet
Spreadsheets are a fine place to start. They become a problem when the business depends on them and nobody can say which copy is right. The warning signs are usually easy to spot once you name them.
If several of these sound familiar, a small, focused tool will often pay for itself in recovered time and fewer surprises. You do not need to replace everything at once. One screen that handles the most painful task is usually the right place to start.
- A weekly report is rebuilt by hand and is out of date by the time anyone reads it.
- Two people edit the same file and overwrite each other's changes.
- Answering a simple question, like "where is this order?", means checking three systems.
- New staff need weeks to learn which tab, filter and formula to trust.
- Approvals happen in email threads, so nobody can see what is waiting.
Admin tools built for the task your team does every day
An admin dashboard is a work surface: search for a record, correct it, approve it, assign it, move on. We design these screens around the handful of actions people repeat all day, so the common path takes a click or two and the rare cases are still possible.
Every change is recorded with who made it and when. Access follows roles, so a coordinator can update a status while only a manager can change pricing or delete a record. When the tool replaces a spreadsheet, we bring the existing data across and keep the columns your team already understands, then add the checks the spreadsheet never had.
That is the heart of the internal tools we build for Houston operations teams, whether the work happens in an Energy Corridor office, a Pasadena yard or a clinic front desk. The screen is plain, fast and shaped around the person who uses it all day.
- 1 Work happens
- 2 Data is recorded once
- 3 Definitions applied
- 4 Dashboard updates
- 5 Team acts
An operations dashboard that ends in a next step
Most dashboards stop at the chart. The ones we build end at a person. An operations dashboard should tell you what is blocked, overdue or missing, who owns it, and what needs to happen next, ordered by what matters most.
Our Industrial Operations Platform is a good picture of this. Work moves from inquiry and quote through engineering, purchasing, production and installation, and every handoff is a recorded change of state. Leadership sees exceptions like a quote about to expire, material running late or a site that is not ready, each with an owner and a next action. That pattern works in almost any business: show the exception, name the owner, make the fix one click away.
A good operations dashboard also knows what it should leave out. If a measure never changes what anyone does, it does not earn a place on the screen. Fewer tiles, each with a clear owner, beat a wall of charts that people learn to ignore.
✕Weekly report rebuilt by hand, stale when it arrives
✓Dashboard updates as soon as work is recorded
✕Approvals buried in long email threads
✓One queue shows every pending approval and its owner
✕Three systems checked to answer one question
✓One lookup screen brings the answer together
✕Two people overwrite the same spreadsheet
✓Each change is saved, checked and attributed to someone
✕New staff guess which tab and formula to trust
✓Screens follow the task, with checks built in
Where a business intelligence dashboard fits
A business intelligence dashboard is built for analysis: trends over months, comparisons between regions, questions you did not know to ask. If you already have a BI tool and it works, keep it. We can feed it cleaner, better-defined data from the systems we build.
Internal tools answer a different question: what should I do right now? They sit inside the daily work, so a manager who spots a late order can reassign it on the same screen. Many teams need both. We help you decide which questions belong in which place, so you do not end up with a chart nobody acts on or a task list nobody can analyze.
Agreeing what the numbers mean
The hardest part of reporting is rarely the software. It is agreeing what "late", "active" or "complete" means, and making every team count it the same way. We settle those definitions with you during Discover and write them into the tool, so a number on the dashboard means the same thing in every meeting.
This matters most for organizations with several sites. A Houston practice group with offices in Katy, Sugar Land and Pearland, for example, can compare intake backlogs or referral turnaround fairly only if each location measures them the same way. For healthcare administration teams, we build dashboards for full HIPAA compliance, keep them focused on operational work and leave clinical decisions with clinicians.
The system handles
- Collecting and combining data
- Flagging overdue and blocked items
- Scheduled report delivery
Your people decide
- Deciding priorities
- Following up on exceptions
- Setting targets
Getting people to actually use the new screen
A tool nobody opens is just another tab. Adoption starts in Discover, when the people who will use the screen help decide what goes on it. If the front desk or the dispatch team sees their own suggestions in the first version, they tend to trust it.
We keep familiar labels, put the most common action where the hand already expects it, and remove steps the old process needed only because the spreadsheet could not check anything. After launch we look at which screens are used, which are skipped and where people still fall back to email, then fix those gaps first.
How we build internal tools for Houston teams
We follow the same five steps on every project: Discover, Design, Build, Launch and Optimize. Discover means sitting with the people who do the work and finding the one or two screens that would make the biggest difference.
We start with a focused first release instead of a long wish list. During Build you see and test working software, so feedback shapes the tool while it is still easy to change. After launch, we watch how people actually use it and adjust. You own the code and the data from day one.
- Discover: watch the work and pick the first screen
- Design: agree definitions, roles and actions
- Build: working software you test as it grows
- Launch: move real data and real users across
- Optimize: refine based on how the tool is used